ICT & Artificial Intelligence
Client company:Fontys Lectoraat Big Data
Kristina Krasteva
Lia Boyadzhieva
Filip Vangelov
Veneta Angelova
Project description
Build a deep learning AI model to help with the large-scale flower monitoring by recognizing and counting different wildflowers in the Netherlands.
Context
With the rapid development of technology and urbanization over the last 50 years, the biological cycle has profoundly changed. Farming has become a leading industry in many countries, the Netherlands including. The excessive use of land for profit and the polluting of the soil with pesticides has undoubtedly influenced the biodiversity of the natural landscape.
Furthermore, these activities alongside other factors, are causing the extinction of a large number of wildlife flower species. These global declines have highlighted the importance of flower species and has created the urge for large scale monitoring for their presumption. However, large scale monitoring requires extensive labour work and is prone to human errors, since it is performed manually. With the fast development of technology and AI, the IT sector has achieved promising results towards achieving this goal.
Results
The goal we were aiming for was to build an AI model and by the end of the project we have provided our client (Gerard Schouten) with 3 different models. But before developing the models, we had to prepare our data.
The pre-processing of the data involved having 2 Jupyter notebooks - one with Exploratory Data Analysis (visualizations about the flower data) and the other with Data Preparation ( cleaning the data). Additionally, for two of the models we needed to use colour detection to detect where on the images there was a specific type of wildflower and crop a small image around the detected area. In the beginning we used RGB values to find the colours, but eventually we improved the code by adding a trackbar with HSV values for an easier and more precise colour detection.
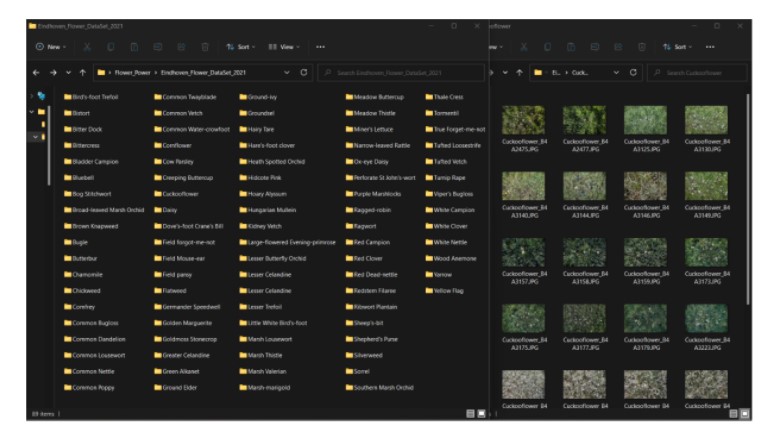
When we received the data it was stored in the following order - main folders with the name of the month (April - July) and in each of the four there were subfolders with the location where the images were taken. The photos themselves were named with an id providing no valuable information. Therefore, another piece of code that we have is the automated sorting of the images. This means that the images were rearranged by folders of the English name of the flower species (taken from an excel sheet given to us). Moreover, attached to the id of the images, the English name was attached. In this way, the data was prepared in a more coherent way.
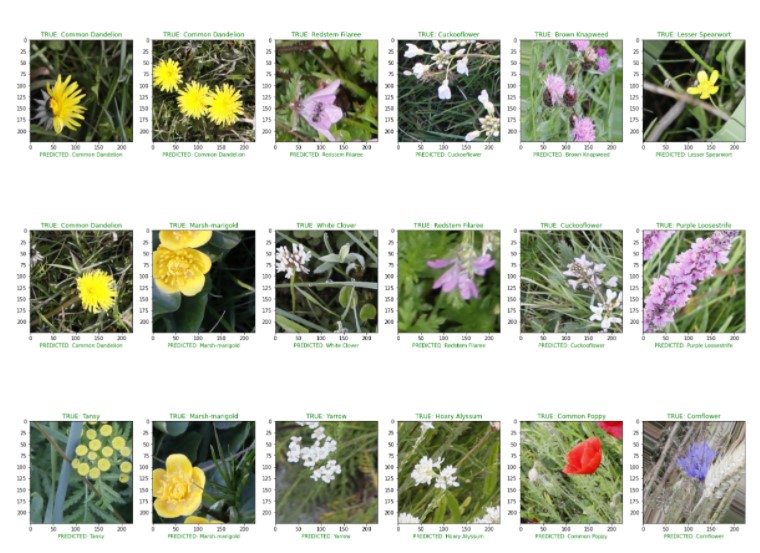
After that we proceeded with the building of the models. First a Faster R-CNN model was developed as a proof of concept. It can recognize and count 5 of the flower types, but since this model requires a huge amount of computing power and time (9 hours) for processing, we wanted to see if we can have a faster and a more optimal solution.
The second model that we built relied on the pre-processed images with the techniques described above. We call it a "custom model" as the layers were done by us. We train this model on 30 flower species for 2 hours and achieve accuracy of 76%.
Thus, we used a pre-trained model (MobileNet-V2) which uses pre-programmed layers and only the last layer is programmed by us. This model used the same preparation as the custom one and it was trained again on the 30 species for 30 minutes and the accuracy score is 98%.
Last but not least, in order to have an evenly distributed data, augmentation was applied to some of the species. We have a piece of code for this as well. In one of the next fields a link to our GitHub is given, but since it is a private repository, if interested please contact Kristina Krasteva.
Methodology
As mentioned above, we have used the CRISP-DM methodology which consists of 6 phases - Business Understanding, Data Understanding, Data Preparation, Modeling, Evaluation and Deployment.
The purpose of the Business Understanding stage is to understand the problem and the requirements, define a clear goal, determine the constraint and risks. Furthermore, the overall planning was done. This step is of great importance as it resulted in a more reliable starting point for the actual modeling. We have provided our client with a Business Proposal with all these things in it.
When the business part of the process was clarified, we proceeded with the data understanding stage. It was an extremely essential phase since it provided us with first insights about the data. To understand the dataset better, our group has prepared an EDA Jupyter notebook where techniques such as pandas profiling, unique flower species, visualizations of the number of flowers per month and flower unit were shown. As a group we have concluded that there were a lot of discrepancies in the dataset provided. With this EDA, we were able to handle them in order to make more consistent and reliable data visualizations.
Next, the Data Preparation stage was about preparing the final dataset that was fed into the model. For the Flower Power project we decided to work only with the image dataset provided by our client and the excel file. As we would not have had the time to train a model for all 122 species, our client listed 15 to be the main focus for us. Eventually, we increased the number to 30 which were fed to the model. Since the spreadsheet was filled with a lot of information that was not relevant for the creation of the model and the analysis, we cleaned it both manually and via a Python code. Moreover, as the column "location" contains the city and extra information regarding where the photo was taken such as district, we splitted the values of the column into two different columns - "location(the city)" and "district". Then the folder rearrangement and the colour detection + cropping part were done. Finally, we synced the data when all of the above-mentioned techniques are applied.
When the data was ready, the Modeling started where a few of different techniques were selected and applied, and their parameters were tuned in search for the optimal solution. With the data not being labeled, modeling became quite an obstacle in the beginning. We researched different methods for labeling but there is still no automatic way to do so. With the 5 types that we have already manually labeled the Faster R-CNN was built. For the custom model and the one using pre-trained layers, our own cropped images were used. In the second iteration of this phase we managed to create the automated cropping we decided to have our own custom model for this project. In this way, we would be able to compare the results between the models. Due to the validation accuracy of the custom model not being as optimal as we desired it to be, in the last few weeks we decided to experiment with a pre-trained model.
After the 3 models were built and trained, we proceeded with the Evaluation phase where the final evaluation and reviewing of the models was done. The three approaches gave impressive results and thanks to the iterative methodology that we have chosen, we managed to improve and expand the models effortlessly.
Usually, the final step is to launch the model. However, we are more focused on delivering the model in such a way that it can be understood and used by future groups or to be integrated in other similar Fontys research projects. During the last 2 weeks, we were focused on writing this report and the accompanying two-page mini paper. They were written by all team members and their purpose is to nicely wrap-up the whole project with its processes, the results, explanations and recommendations. The transfer of the code is of vital importance for the successful finish of this project. As we stored the project in GitHub, this is the main place where it can be found. Both our technical tutor and our client have access to the repository. In addition to it, we have uploaded our project to DEX (https://dex.software/project/details/172)
About the project group
The project team consist of 4 members all doing the ADS Minor 2021/2022. All of us are international students, two of whom are following the ICT & Business English stream and the other two the ICT & Software. We all had some prior knowledge and experience in Data Science, however this was the first time we were applying Deep Learning techniques. The project continued throughout the whole minor (18 weeks) in which we spent 16 hours per person per week dedicating to the project. We worked in an Agile way adjusted for a Data Science project meaning we were following the IBM CRISP-DM methodology.

